

Japanese Net-Net Basket: Part 2
Overviews of 17 Japanese net-nets
In this post, I am back with further research and thoughts on Japanese net-nets. This is the second article in a three-part series, where I cover cheap, cash-rich companies listed in Japan. Given the recent positive corporate governance reforms in the country, I have decided to add a basket of five Japanese net-nets to the Idea Hive portfolio.
In the first article, I outlined the case for investing in Japanese net-nets in more detail, followed by a discussion of stock selection criteria and screening. I would highly recommend reading the first part if you haven't already. To quickly summarize, while there have historically been plenty of net-nets in the Japanese market, recent corporate governance reforms in Japan make them particularly interesting currently. The reforms are already bearing fruit, as seen in companies’ improved board compositions, a surge in activist campaigns, and increasing capital returns in the form of dividends and buybacks to equity holders. While Japanese equities have already partially re-rated since these corporate governance changes were initiated, many opportunities remain, particularly within the subset of the cheapest companies listed in Japan.
As for the selection process, I am using the following criteria:
Net cash is over 60% of the market cap.
TTM P/E is less than 10x.
Combined dividend and stock buyback yield above 3% on a TTM basis.
Market cap is between $50m and $2bn.
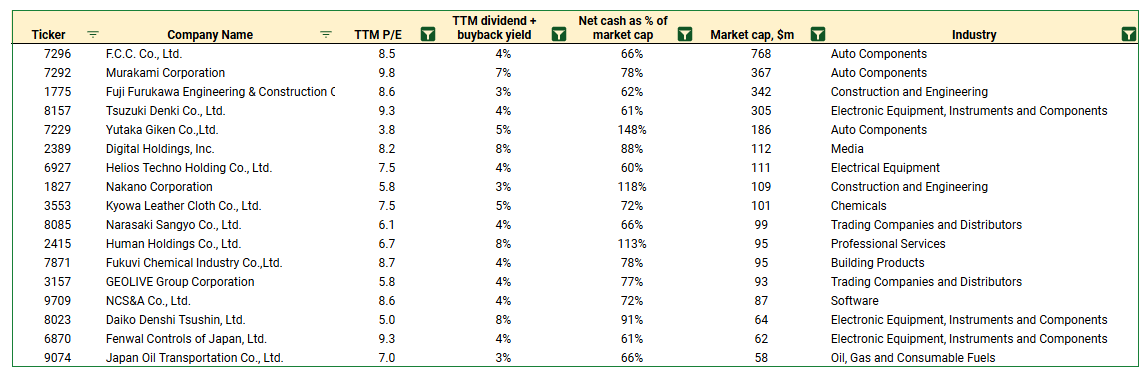
Using these criteria, and after filtering out companies without English financial filings or an English IR page, I arrive at a list of 17 companies (see below). I would quickly note that the criteria (and thus screener results) differ from those outlined in the first article, as I made some adjustments after a preliminary analysis of the initial screener results.
This brings me to the second article, where I provide a quick overview and my thoughts on these companies as potential additions to the Japanese net-net basket.
Now, while one could quibble over differences in valuation multiples and net cash positions, it’s fair to say that all of the 17 companies are cheap on key valuation metrics and boast large net cash positions. So, how do we identify which companies are the most compelling additions to the net-net basket?
Well, given that the case for investing in Japanese net-nets revolves around corporate governance improvements, my key goal is to pick companies with the potential for improvements in capital allocation in the coming years. How do we identify such companies? Here’s what I am looking for in a potential net-net basket candidate:
A management team with a track record of growing dividends and/or stock buybacks. I would prefer companies with substantial increases in returns to equity holders in recent years. Such increases might indicate a significant positive change in a company’s capital allocation policies, which could potentially drive a stock price re-rating.
A track record of consistent growth or a business operating in an industry with secular tailwinds. This aspect is straightforward—continued revenue and profitability growth could support significant dividend and/or stock buyback increases. Conversely, I would generally avoid investing in businesses operating in declining industries, as such companies’ capital allocation policies are generally less likely to change markedly.
A capital-light business. A business with lower reinvestment requirements can generally retain a higher portion of its earnings, which could then be distributed to equity holders. Another angle is that capital-light companies can compound their book value per share more quickly, adding value for equity holders on top of dividends and/or stock buybacks.
So, these are the key criteria that might help identify companies on the cusp of significant improvements in capital allocation. I would also highlight several other important criteria related to the industry a company operates in: it should be 1) within my circle of competence and 2) not highly cyclical.
To see how the 17 companies stack up in regard to these aspects, the discussion of each company includes a brief overview of the business, operational performance, and capital allocation. Let me note that these are not detailed analyses, but rather high-level thoughts on whether the companies might be attractive additions to the net-net basket.
Now, let’s dive right in.
F.C.C. Co (7296-T)
Market cap: $768m
Net cash as % of market cap: 66%
TTM P/E: 8.5x
TTM dividend + buyback yield: 4%
F.C.C. (referred to as FCC) is a manufacturer of clutches primarily for automobiles and motorcycles. Company’s customers include well-known car and motorcycle manufacturers, most notably Honda (c. 40% of revenues in FY24). Forty-three percent of revenues are generated in the U.S., followed by 13% in India and 12% in Indonesia.
After declining during COVID, FCC’s revenues have been growing rapidly since 2021, with double-digit growth over the last three fiscal years. This revenue expansion has been propelled by strong demand for motorcycle clutches in India and Indonesia, while the automobile business has grown due to rising demand from North America despite EV-related headwinds (EVs do not require clutches). Management expects flat revenues in FY25 and FY26, as these headwinds are expected to be offset by continuing strong demand for motorcycle clutches from India and Indonesia and significant growth investments in new product areas, including electric components and power units.
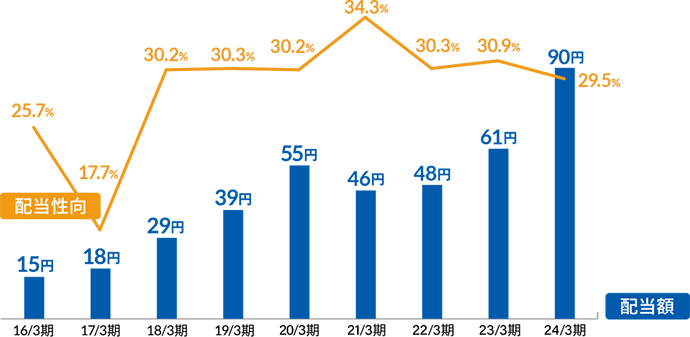
In recent years, FCC has steadily paid out c. 30% of its net income as dividends, with ¥76/share (3% yield) expected to be distributed in FY24 (see the chart below). Besides consistent dividend growth since FY21, what makes FCC interesting is the fact that management initiated substantial stock buybacks in Q1 FY24 at 1% of the current market cap. Given that FCC previously last completed stock buybacks in FY19, the recent stock buybacks might be indicative of positive changes in capital allocation policy.

Murakami Corporation (7292-T)
Market cap: $367m
Net cash as % of market cap: 78%
TTM P/E: 9.8x
TTM dividend + buyback yield: 7%
Murakami primarily produces automobile components, including rearview, electronic, and concave mirrors. The company holds the highest market share in Japan for automobile rearview mirrors.
Murakami has grown rapidly in recent years, with a 19% revenue CAGR since FY21. This growth has been driven by recovering production rates among automobile manufacturers, thanks to the easing shortage of semiconductor parts seen in previous years. Management expects growth to continue, projecting mid-single-digit growth in the current fiscal year. While Murakami’s gross margins have improved from COVID lows, they remain substantially below pre-pandemic levels (15% in FY23 vs c. 19% pre-COVID). So, there might be room for margin improvement in the coming years. Murakami has historically been somewhat capital-intensive, however, worth noting that management has managed to grow book value per share at an impressive rate (8% CAGR) over the last decade.
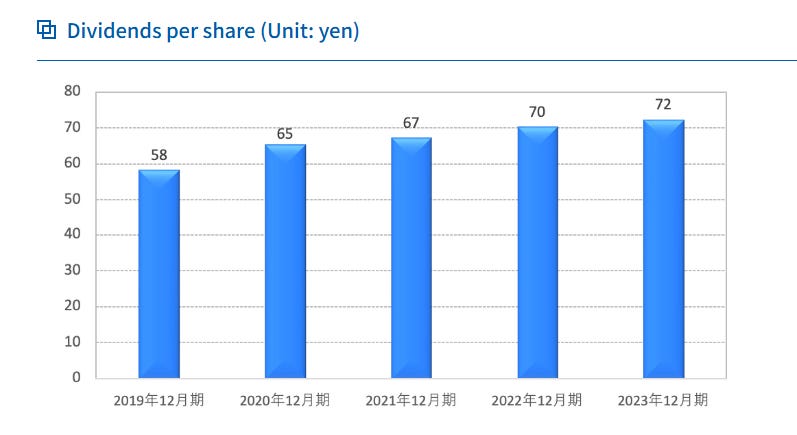
Murakami’s historical dividend payout ratio has been relatively low, below 20%, but the payout ratio saw substantial growth to 32% in FY24 (see the chart below). Management expects to pay a slightly higher dividend of ¥180 per share (4% yield) in the current fiscal year. Another positive aspect is that Murakami significantly ramped up the pace of stock buybacks in FY23, repurchasing 4% of the current market cap. Given the company’s recent growth and notable improvements in capital allocation, Murakami stands out as an interesting basket candidate.

Fuji Furukawa Engineering & Construction (1775-T)
Market cap: $342%
Net cash as % of market cap: 62%
TTM P/E: 8.6x
TTM dividend + buyback yield: 3%
Fuji Furukawa provides design, engineering, and construction services. The company primarily focuses on the design and installation of electrical equipment and power line construction for public facilities, such as waste treatment facilities and manufacturing plants (two-thirds of total revenues). The remaining business primarily comprises air conditioning equipment construction for offices, medical, and other facilities. The vast majority of sales (>90%) are generated in Japan.
Fuji Furukawa has a long track record of revenue growth (with the exception of FY19-FY20) and consistent profitability. More recently, Fuji Furukawa’s revenues have grown at an impressive, mostly double-digit rate over the last three fiscal years. This growth was driven by the company securing multiple major orders for new construction projects or renovation/other work for existing large-scale projects, such as semiconductor manufacturing and nuclear power plants. After significant order growth in recent years, management expects growth to slow materially/turn negative in the coming years, with a 9% revenue decline forecasted for FY24 and flat revenues expected in FY26 compared to FY23.
Fuji Furukawa’s management has steadily increased the dividend in recent years, with the dividend growing from ¥70-75/share in FY18-FY20 to ¥190/share in FY23 (3% yield). However, given the anticipated slowdown in operational performance, the dividend is unlikely to grow significantly in the coming years—management expects it to remain stable in FY24. Another drawback on the capital allocation front is that the company has not pursued any stock buybacks recently.
Tsuzuki Denki Co (8157-T)
Market cap: $305m
Net cash as % of market cap: 61%
TTM P/E: 9.3x
TTM dividend + buyback yield: 4%
Tsuzuki Denki provides design, development, construction, and maintenance of network/information systems. Services and solutions offered by the company include application/system development, network equipment and software setup, cloud services, and operational support desks, among others. Tsuzuki also previously operated an electronic devices business (which accounted for c. 20% of sales) that was divested in 2023, transforming the company into a pure-play ICT services provider. Tsuzuki's customers span a variety of end markets, including manufacturing (20%), services (15%), and ICT industries (15%), among others.
Under the current management team (new president was appointed in 2017), Tsuzuki has mostly displayed low/mid-single-digit revenue growth, driven partially by growing IT/network construction/cloud migration investments by Japanese companies. Worth noting that both of management’s previous three-year plans exceeded expectations, with revenues, operating income, and ROE coming in above initial targets. Management expects topline growth in FY24 to remain flat (pro forma for the divestiture). As for margins, company’s gross and operating margins have jumped substantially since FY19, partly due to an increasing share of revenues from higher-margin services. While the sustainability of the margin increase is uncertain, the sale of the electronic devices business will likely help maintain margins at current levels. Tsuzuki’s management has guided for a slight growth in operating margins in FY24.
In terms of capital allocation, the company has steadily increased its dividend in recent years, including from ¥61/share in FY22 to ¥90/share in FY23, with the dividend payout ratio generally at a respectable 30%+ (see the chart below). The company expects the dividend to remain essentially flat at ¥91/share in FY24 (4% yield). Tsuzuki initiated stock buybacks in FY23, however, these were insignificant (<1% of the current market cap) and not unprecedented, as the company has previously pursued similar share repurchases sporadically.
Yutaka Giken Co (7229-T)
Market cap: $186m
Net cash as % of market cap: 148%
TTM P/E: 3.8x
TTM dividend + buyback yield: 5%
Yutaka Giken manufactures automobile parts, primarily including exhaust systems (e.g., catalytic converters and silencers) and motor systems (e.g., rotor shafts). Company's key customers include Honda and Suzuki. Yutaka’s products are sold primarily in China (40% of revenues), Japan (20%), and North America (30%).
Yutaka Giken’s revenues consistently grew during FY20-FY22 before a slight decline in FY23 due to lower orders from company's key market, China, offsetting growth in company's remaining geographic segments. Management expects weak demand from China to persist in the near term, with a steep revenue drop of -19% guided for FY24.
Yutaka’s management has increased the dividend in recent years, raising it from ¥72 per share in FY22 to ¥90 per share in FY23. However, management expects the dividend to return to ¥72 per share (a 4% yield) in FY24. The company has not been buying back any stock in recent years. These factors, coupled with the fact that Yutaka has historically been a capital-intensive business, indicate that significant improvements in capital allocation over the near to medium term are unlikely.
Digital Holdings (2389-T)
Market cap: $112m
Net cash as % of market cap: 88%
TTM P/E: 8.2x
TTM dividend + buyback yield: 8%
Digital Holdings is a holding company with three operating segments: 1) Marketing (digital advertising services), 2) Financial Services (BNPL), and 3) Investment Business (investment firms managed by Digital Holdings). In early 2022, the company completed a large divestiture of the SoldOut business (provided digital marketing services).
Over the recent years, Digital Holdings’ profitability has improved markedly, with the company turning profitable on EBIT and net income level in FY23. This has been driven largely by the solid performance of the Investment Business, which accounts for the majority of company’s TTM EBITDA and net income. Segment's AUM has been expanding recently, and management expects the business's profitability to continue growing in the current fiscal year. As for the other two segments, sales in the Marketing business have been flat or declining in recent quarters. Meanwhile, unprofitable Financial Services business's sales and GMV, after several years of rapid growth, have recently flattened.
As for capital allocation, Digital Holdings has historically grown its dividend, with only a minor reduction in annual dividends following the SoldOut divestiture (see the chart below). The dividend yield currently stands at an impressive 8%. I would also highlight that, following the divestiture, Digital Holdings completed substantial stock buybacks, repurchasing c. 12% of company’s current market cap in H2 2022. Considering these aspects, it might be reasonable to state company’s capital allocation has generally been shareholder-friendly.

Helios Techno Holding Co (6927-T)
Market cap: $111m
Net cash as % of market cap: 60%
TTM P/E: 7.5x
TTM dividend + buyback yield: 4%
Helios Techno is an electrical equipment producer operating in two key segments: Manufacturing Equipment and Lamps. The Manufacturing Equipment segment (75% of revenues) comprises orientation film printing devices, specialized printers, and testing/measuring equipment. In the Lamps business (25% of sales), the company manufactures various types of lamps, including those for projectors, halogen lamps for general lighting, and LED lamps.
Helios Techno’s revenues significantly deteriorated with the onset of COVID-19, which impacted company’s key market for manufacturing equipment, China, while the lamp business remained flat. More recently, in FY23, the performance of the manufacturing equipment business improved, with a massive 100%+ jump in production volumes and orders amid a recovery in demand for manufacturing equipment in China. Management expects these tailwinds to continue, projecting a 9% revenue growth for the current fiscal year. Nonetheless, the company appears to have temporarily benefited from elevated margins since FY19. Potential margin normalization is indicated by management's expectation that operating income will decline by 33% in the current fiscal year despite solid sales growth.
As for capital allocation, in FY23, after years of minimal dividend increases, Helios’ management significantly raised the dividend from ¥8 per share in FY22 to ¥35 per share. However, this is likely to be a one-off increase, as the company expects a significantly lower dividend of ¥12 per share in FY25 (1.5% yield). The company has not completed any stock buybacks in recent years.
Nakano Corporation (1827-T)
Market cap: $109m
Net cash as % of market cap: 118%
TTM P/E: 5.8x
TTM dividend + buyback yield: 3%
Nakano Corporation is a construction and engineering company operating primarily in Japan, followed by several Southeast Asian markets, including Singapore, Malaysia, Indonesia, Thailand, and Vietnam. The company designs and constructs properties across a variety of classes, including residential, industrial, hospital, education, and other buildings/facilities.
Company’s operational performance has mostly been stable in recent years, with slowing residential construction investment in Japan offset by solid demand in the non-residential real estate sector. Management expects revenues to remain flat in the current fiscal year.
Over the past couple of years, Nakano has increased its dividend from ¥10 per share in FY21 to ¥16 per share in FY23, though this is not too far off from the pre-pandemic levels of ¥14 per share. The dividend is projected to remain unchanged at ¥16 per share (a 3% yield) for FY24. The company has not initiated any stock buybacks in recent years. Given the anticipated low growth and lack of substantial capital returns to equity holders over the recent years, I do not think Nakano Corporation is an attractive basket candidate.
Kyowa Leather Cloth Co (3553-T)
Market cap: $101m
Net cash as % of market cap: 72%
TTM P/E: 7.5x
TTM dividend + buyback yield: 5%
Kyowa Leather Cloth primarily manufactures synthetic leather (PVC and PU) cover materials used in automotive interiors. Most of company’s revenues are generated domestically.
Kyowa Leather has historically been a capital-intensive business exposed to the cyclicality of the automotive market. Company’s revenues have grown at a decent pace after bottoming in FY20, propelled by increasing demand from automobile manufacturers, and have now exceeded pre-pandemic levels. For the current fiscal year, management expects growth to remain flat at 2%. Company’s margins are now in line with pre-COVID levels at 19%, after declining to as low as 16% during the pandemic years.
Kyowa’s capital allocation does not appear particularly exciting. The dividend per share has generally hovered around ¥32 per share, or a 5% yield, in recent years (with the exception of the COVID years) and is expected to remain at the same level in FY24. Considering company’s historical dividend track record and the lack of stock buybacks over the past couple of years, any substantial inflection in capital allocation over the near to medium term seems unlikely.
Narasaki Sangyo Co (8085-T)
Market cap: $99m
Net cash as % of market cap: 66%
TTM P/E: 6.1x
TTM dividend + buyback yield: 4%
Narasaki Sangyo distributes electric equipment, machinery, building materials, and petroleum products to industrial customers and households in Japan. Company’s key segments are Electrical Equipment (power distribution control devices, air conditioning equipment, etc.), Machinery (agricultural and industrial machinery), and Construction and Energy (cement, ready-mix concrete, building materials, petroleum products).
Company’s revenues have grown at a nice mid- to high-single-digit pace since FY20, driven largely by solid performance in the electrical equipment and construction/energy businesses. Management expects low-single-digit revenue growth in FY24. Narasaki Sangyo is a capital-light business with impressive historical growth in book value per share. Nonetheless, due to the number of different segments (and their underlying drivers), along with the fact that some of them are cyclical, Narasaki Sangyo falls into the "too hard" pile for me.
Narasaki’s management has generally been raising the annual dividend in recent years, however, the dividend is expected to remain unchanged at ¥105 per share in FY24 (3.5% yield at current prices). No share buybacks have been completed in recent years.
Human Holdings Co (2415-T)
Market cap: $95m
Net cash as % of market cap: 113%
TTM P/E: 6.7x
TTM dividend + buyback yield: 8%
Human Holdings operates in the human resources, education, nursing care, and other sectors in Japan. Company’s key Human Resources segment (c. 60% of revenues) primarily comprises staffing services. In the second-largest Education segment (c. 30%), the company provides specialized training and language courses, among other services.
Human Holdings is a capital-light business with a track record of generally consistent growth over the last decade, with a 6% revenue CAGR since FY12. This growth has been propelled largely by the continuing trend of increasing demand for recruitment outsourcing in Japan (e.g., see here). This tailwind, coupled with the demand for a foreign labor force given the declining domestic labor force, indicates that growth is likely to continue. While I have not come across medium-term growth targets, Human Holdings’ management expects 4% revenue growth in FY24.
Company’s management substantially raised the dividend recently, increasing it from ¥27-31 per share over the preceding three years to ¥62.5 per share in FY23. Management expects a dividend of ¥64 per share (4.5% yield) in the current fiscal year. The company has also recently initiated stock buybacks, with 3.5% of the current market cap repurchased in FY23. So, it is reasonable to state that there have been significant improvements in capital allocation recently. Another noteworthy aspect is that the company CEO’s family holds a sizable 20% stake in the company.
Fukuvi Chemical Industry Co (7871-T)
Market cap: $95m
Net cash as % of market cap: 78%
TTM P/E: 8.7x
TTM dividend + buyback yield: 4%
Fukuvi Chemical Industry primarily manufactures synthetic resin and other products for construction and industrial end markets. In the Building Materials segment (c. three-quarters of total revenues), Fukuvi produces a variety of interior and exterior building products, including windproof sheets, resin tile battens, bath panels, and insulation materials, among others. The Industrial Materials segment (one-quarter of revenues) includes window frames, doors, and furniture, among other products.
Given its exposure to the building materials industry, Fukuvi is a cyclical business largely driven by new housing starts in Japan. Company’s revenues and operating income have been growing over the last several years after bottoming during COVID-19, returning close to pre-pandemic levels (see the chart below) due to increasing demand for housing in Japan. More recently, in FY24, slight revenue and operating income growth was driven by solid performance in the Industrial Materials segment, offsetting the decline in the Building Materials business amid a continuing decrease in new housing starts in Japan and the negative impact of elevated naphtha prices (naphtha is a key input in resin production). Management has guided for slight revenue growth in FY24.

The company significantly increased the dividend from historically stable levels of ¥15-¥23/share (during FY15-FY22) to ¥31/share in FY23. However, management expects the dividend to be lower in FY24 at ¥26 per share, or a 3.5% yield. I would also highlight that in FY22, the company initiated a significant stock buyback of c. 2% of the current market cap, but no buybacks were completed in FY23. So, the improvements in capital allocation seen over recent years might be one-off, sporadic returns for equity holders rather than a lasting enhancement of company’s capital allocation policies. Another angle is that these dynamics highlight that Fukuvi is a cyclical business, where potential capital allocation improvements will depend on the housing industry environment in Japan, which significantly impacts company’s operational performance.
GEOLIVE Group Corporation (3157-T)
Market cap: $93m
Net cash as % of market cap: 77%
TTM P/E: 5.8x
TTM dividend + buyback yield: 4%
GEOLIVE distributes building materials (e.g., plywood) and housing equipment for the residential real estate industry in Japan. Sales are made to both wholesale (54% of revenues) and retail (38%) customers. The company primarily focuses on the Kanto-Shinetsu region.
Similar to Fukuvi Chemical Industry, the key driver of GEOLIVE’s operational performance is new housing starts in Japan. Given the significant decline in housing activity in FY23 (down 7%), GEOLIVE’s operational performance has been negatively impacted, with revenues declining by 9% (see the chart below; columns depict housing starts, while the blue line represents revenues). Management expects flat sales in FY24 but is more optimistic for the following years—company’s medium-term plans guide for FY26 sales to align with peak FY22 levels. I do not have a strong view on whether this guidance is reasonable, but given the recent housing trends in Japan, the forecast could be overly optimistic.

While GEOLIVE’s dividend was substantially increased in FY22 to ¥44 per share (vs ¥20/share in FY20), management has not raised it since and expects the dividend to shrink to ¥38 per share in the current fiscal year (3.5% yield). Although the payout ratio has been increasing in recent years, I would note that it is still relatively low, with a forecasted payout ratio of 27% for FY24. The company has not completed any stock buybacks in recent years.
NCS&A Co (9709-T)
Market cap: $87m
Net cash as % of market cap: 72%
TTM P/E: 8.6x
TTM dividend + buyback yield: 4%
NCS&A provides IT services, including system design, software development, hardware maintenance, and system support, among others.
NCS&A’s revenues have steadily declined in recent years after peaking in FY19, following a surge in demand for IT services (see the chart below). Company’s margins, on the other hand, have consistently grown, with gross margins now at 30%, compared to 22-23% pre-pandemic. This margin improvement appears to be driven partly by a focus on higher-margin services and an increasing share of revenue from services and solutions using company’s own products (e.g., NCS&A’s information system visualization software and personal credit information connection service). Management expects margins to remain at current levels or increase, with 10% operating income growth projected for the current fiscal year (versus flat revenue growth).

As for capital allocation, NCS&A has significantly increased its annual dividends in recent years, from ¥15 per share in FY20 to ¥30 per share in FY23. Management expects to pay out a dividend of ¥38 per share (4.5% yield) in the current fiscal year. The company has historically completed stock buybacks sporadically, however, I would note that these were minimal over the last couple of years.
Daiko Denshi Tsushin (8023-T)
Market cap: $64m
Net cash as % of market cap: 91%
TTM P/E: 5x
TTM dividend + buyback yield: 8%
Daiko Denshi Tsushin is an IT services provider that operates in two segments: Solutions Services (approximately 75% of revenues) and ICT Devices (25%). The Solutions Services business comprises network infrastructure, software development, and other services. In the ICT Devices segment, the company sells information communications equipment (e.g., from Fujitsu) and provides related services. Daiko Denshi has the largest exposure to two key end markets: the manufacturing and distribution/services industries.
Daiko Denshi is a capital-light business with a track record of solid historical growth, except for a revenue decline following a COVID-induced boost in ICT equipment in FY19. Daiko’s gross margins have been steadily rising in recent years, currently at 26% compared to c. 20% pre-pandemic. This improvement appears partially driven by 1) the growth of Solutions Services relative to ICT Devices in the revenue mix, and 2) an increasing share of services that use company’s own products in the Solutions Services segment. While I am uncertain if these margins are sustainable, some margin normalization seems likely. I would highlight that management has projected a significant 24% decline in operating income for the current fiscal year (compared to a 6% revenue decline).
Although Daiko Denshi Tsushin’s management has been increasing the dividend in recent years, the dividend payout ratios remain relatively low, at below 30%. Nonetheless, what makes Daiko interesting from a capital allocation perspective is the significant ramp-up in the pace of stock buybacks over the last couple of years. In FY23, the company repurchased 5% of its current market cap. Coupled with the 3% dividend yield, this brings the total FY23 capital return yield to a quite impressive 8%.
Fenwal Controls of Japan (6870-T)
Market cap: $62m
Net cash as % of market cap: 61%
TTM P/E: 9.3x
TTM dividend + buyback yield: 4%
Fenwal Controls manufactures fire prevention, temperature control, and medical equipment. Company’s key SSP segment (50% of revenues) includes fire alarm systems, fire extinguishing systems, and heat detectors, among other products. The next largest segment, Thermal (27%), comprises temperature controllers, temperature sensors, and thermoswitches.
Fenwal’s revenues have mostly been flat in recent years, as deteriorating performance in the key SSP segment has been offset by steady growth in the Thermal business due to strong demand from the semiconductor manufacturing equipment end market. More recently, in H1’24, the recovery in the SSP business was offset by a decline in the Thermal segment, which the company has referred to as "a stagnation of the semiconductor industry." Management expects flat sales in the current fiscal year, with operating income projected to decline markedly by 12%. I would like to highlight that Fenwal’s operating margins in the SSP business doubled in H1’24 (34% vs. 17% in H1’23) due to higher-margin gas fire extinguishing projects.
Fenwal’s annual dividend has been growing steadily, but at a relatively insignificant pace over the last couple of years (see the chart below), with a small increase to ¥74 per share (4% yield) expected for the current fiscal year. Management has not completed any significant stock buybacks in recent years. Given management’s track record of shareholder returns, coupled with projected flat business performance, it is difficult to expect any significant changes in capital allocation in the near or medium term.
Japan Oil Transportation Co (9074-T)
Market cap: $58m
Net cash as % of market cap: 66%
TTM P/E: 7x
TTM dividend + buyback yield: 3%
Japan Oil Transportation provides transportation services for petroleum products, LNG, and petrochemical products. Around half of company’s revenues are generated from the transportation of petroleum products, including gasoline, crude oil, and kerosene, via railroad tank cars and tanker trucks. The other two key segments, LNG (transported via tanker trucks and railroad tank containers) and petrochemical products (transported via containers), each represent approximately 25% of JOT’s revenues.
Japan Oil Transportation is generally a stable business, as indicated by steady revenues and return on equity (ROE) generated over recent years (see the charts below). I would like to highlight that the improvement in operating margins since FY19 has been largely driven by the steadily increasing profitability of the petrochemical product transportation segment.
JOT’s dividends have generally been flat recently, with a dividend payout ratio at a relatively low 24% over the last four years (with the exception of 2021). This, coupled with company’s high historical capital expenditures and lack of stock buybacks, suggests that any significant improvements in capital allocation are unlikely.

Conclusion
This wraps up the second part of the article series on Japanese net-nets. My analysis indicates that multiple companies fulfill my criteria and thus might be attractive candidates for the Japanese net-net basket. I intend to return with the third and final article, where I will present my Japanese net-net basket, likely in the coming weeks.
Thanks for the informative article! Looking forward to part 3.
a lot of these are not net nets