Exploring The Met Coal Industry: Part 2
What makes metallurgical coal producers interesting right now?
In this post, I am back with further research and thoughts on the metallurgical coal industry. This is the second article in a three-part series covering the met coal space.
In the first article, I discussed the investment case for the met coal industry, including the supply and demand outlook and the competition from electric arc furnaces. I would highly recommend reading the first part if you haven’t already. To quickly summarize, new supply capacity expected to come online is limited, while demand for met coal will likely grow or remain stable in the coming years, driven largely by increasing steel demand from developing countries, primarily India. Meanwhile, electric arc furnaces are unlikely to replace traditional blast furnaces in the coming decades, as most new steel production capacity will comprise blast furnaces. So, it is reasonable to conclude that the outlook for met coal producers is favorable, and thus I’d be hard-pressed to label it a dying industry.
After reading the first article, you might be thinking, "Okay, I can see why the outlook for met coal producers is favorable. But what makes them attractive as an investment at this point in time?" Well, as I highlighted in the first article, met coal producers are currently trading at fairly undemanding multiples. I could point to several US- and Australia-listed coking coal producers, including ARCH, METC, and SMR-AX, trading at around 5-8x forward P/FCF multiples.
Now, met coal is obviously a cyclical industry, so the attractiveness of these valuations depends on where we are in the cycle. After all, if met coal prices are currently at mid-cycle or peak levels, you could reasonably argue that the 5-8x forward P/FCF valuations are appropriate, if not overly generous, for commodity producers.
So, where do we stand in the met coal cycle? In this article, I will explore this aspect in more detail.
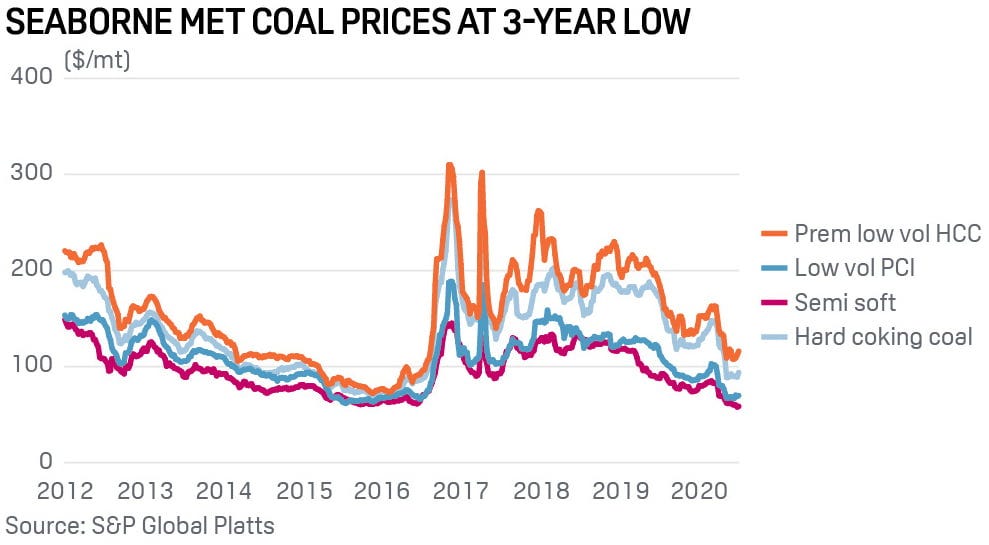
Let’s start with an overview of current and historical met coal prices. While met coal prices vary considerably depending on coal grade and quality, for simplicity, let’s consider a popular and widely used benchmark: the price of premium low volatility hard coking coal (PLV HCC). As shown in a slide from WHC-AX, the price of PLV HCC hovered around $100-$150 per ton before spiking in 2022 due to a confluence of factors, most notably the Russia-Ukraine war. Since then, prices have moderated, with PLV HCC hovering around c. $240/ton in Q2’24. I’d quickly note here that met coal prices have declined in recent months, falling below $200 per ton, however, this is attributed mostly to a seasonal decrease in the demand for steel.
For a longer historical perspective, I would refer you to the slide from ARCH below, which highlights historical hard coking coal prices adjusted for inflation. The chart shows that, while met coal prices have normalized since the 2022 peak, they have remained significantly above previous trough levels when adjusted for inflation as of last year.
So, from a quick glance at these charts, you might conclude that we are currently close to mid-cycle met coal price levels. However, while this may eventually prove to be correct, I believe it is more likely than not that we are currently near the bottom of the met coal industry cycle. Let me explain.
A good place to start is the fact that several U.S.-listed met coal producers are currently operating at or close to break-even levels. To illustrate this, let’s consider the specific example of AMR, the largest U.S.-based met coal producer. On the cost side, AMR expects metallurgical coal production costs of $110-$116 per short ton in 2024. While the company has not provided guidance for the costs of transporting the met coal to the shipping port, assuming transportation expenses in line with Q2’24 would imply additional costs of $36 per short ton. Adding the projected SG&A ($4 per short ton), the total production cost comes to $150-$156 per short ton. Note that this is before considering the impact of sustaining capital expenditures and taxes.
Now, comparing the PLV HCC price to AMR’s production costs is not appropriate, given that AMR primarily produces and ships lower-quality HVA, HVB, and MV coals (with LV coal comprising only 15% of the mix by tonnage in 2023). This implies that the company inevitably realizes a lower price than the PLV HCC benchmark. Here we can consider the prices at which AMR expects to sell the majority of its metallurgical coal this year (note that vast majority of AMR’s and other U.S.-based producers’ coal shipments are pre-contracted, i.e., the spot market is minimal). For 2024, the company expects to realize committed and already-priced metallurgical coal volumes (71% of total estimated 2024 volumes) at an average price of $158 per short ton, i.e., close to the estimated production cost. As for the remaining committed but unpriced volumes, let’s simply assume that they will be priced at the same rate (compared to $142 per short ton average selling price in Q2 2024).
So, the situation we are in is that at the current coking coal price levels, the largest producer in the U.S. is operating at break-even levels. The same analysis for several other U.S.-based producers, including ARCH and METC (with lower-cost producer HCC being an exception), would confirm that the marginal costs in the industry are at or close to the currently realized met coal prices. These dynamics have been highlighted by managements of U.S.-listed met coal producers—for example, see the quote from ARCH’s Q2’24 conference call:
We believe that the current coking coal prices are below the marginal cost production on a global basis. We achieve accurate, we'll take predictable coal on production minings over time, assuming such prices persist.
This is important because met coal producers naturally require a return on capital for their operations. AMR and other U.S.-based producers could, in the short term, sustain operations at lower met coal price levels given the high fixed costs (i.e., shutting down production can be more expensive than continuing to operate). However, any prolonged deterioration in met coal prices would lead to losses for producers and would thus incentivize production cuts or mine idling in an effort to raise met coal prices.
Now, you might be thinking, "But why are AMR and other U.S.-listed met coal producers the right reference point here? After all, if they are among the highest-cost producers globally, they could remain unprofitable during part of the met coal cycle, while lower-cost producers might still maintain solid margins and remain profitable."
To address this question, I believe two key points need to be established:
Met coal prices during cycle downturns generally do not fall below the costs of marginal producers.
AMR and several other U.S.-listed producers are the world’s swing producers.
First, let’s take a brief step back and explore the concept of "swing producers." For those unfamiliar, these are marginal producers whose production costs are among the highest in the industry. These producers sit at the edge of the supply curve, so if prices fall below their production costs, they would no longer be able to cover variable costs, leading to operational shutdowns and, thus, supply reduction.
How do we define "marginal producers"? If you look at analyses and publications across the commodity space, you will likely come across the so-called 90th percentile producers on the global cost curve. For a quick background, cost curves represent the cost of production for different coal mines, ranked from the lowest to the highest production cost. They visually show the relationship between the amount of coal produced and the corresponding production costs per unit, usually per ton. The 90th percentile cost represents a point on the curve where 90% of total global production comes from mines with lower costs.
Proceeding to the met coal space specifically, let’s establish one of the key points: met coal prices tend to bottom at the costs of 90th percentile producers. To illustrate this, I would refer you to the slide below from Wood Mackenzie’s 2015 presentation. The chart on the right clearly shows that during 2000-2014, met coal prices bottomed at the 90th percentile producer cost levels.
If you look at met coal prices in the subsequent years (see the chart below), you will see that there were two PLV HCC met coal price bottoms since 2014: c. $80/ton in 2015-2016 and approximately $100/ton at the height of COVID restrictions in 2020. How did these price levels compare to the 90th percentile costs? According to this cost curve, at the time of the price drop in 2015-2016, the 90th percentile production cost was around $90/ton, only marginally above the met coal price bottom. Meanwhile, the 90th percentile cost in 2019 was around $160/ton, so well above the met coal price at the time. Nonetheless, I would highlight that 1) the decline in met coal price was driven by a massive, once-in-a-generation COVID shock, and 2) met coal prices swiftly recovered to significantly higher levels by the end of 2020. So, while one could argue that the 90th percentile production cost has not been a perfect, foolproof indicator for predicting met coal price bottoms over the last 10 years, I think it is reasonable to conclude that it directionally indicates whether we might have reached a met coal cycle bottom.
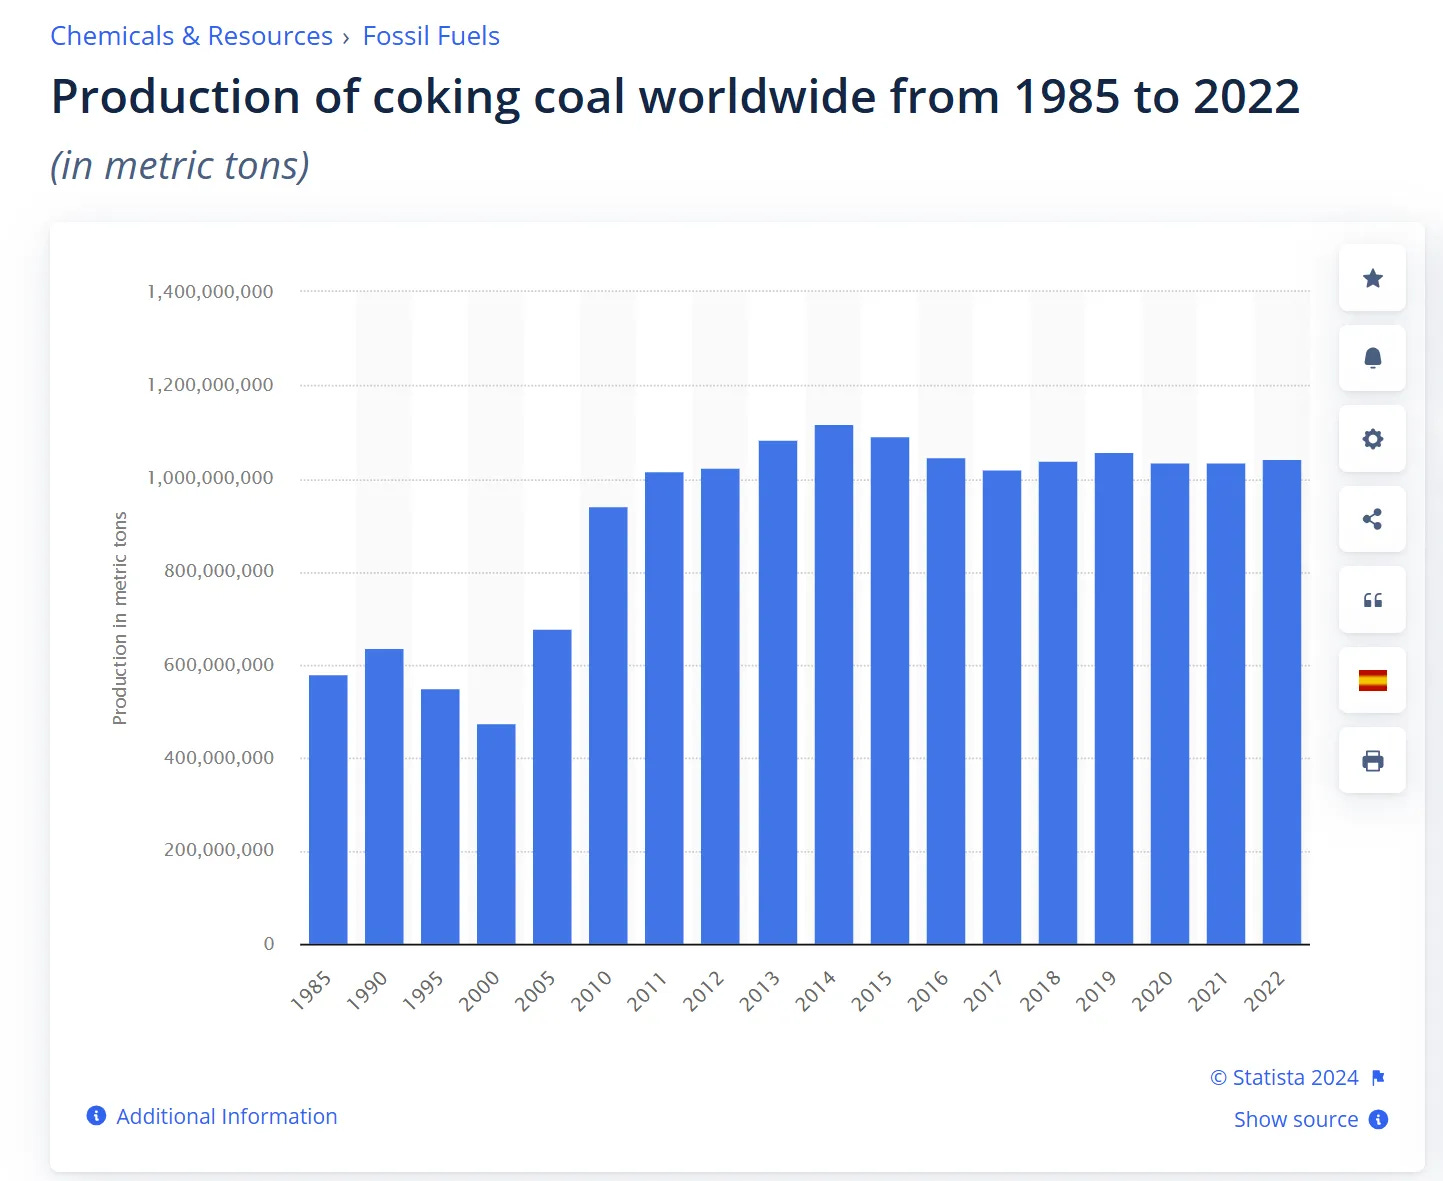
What is the explanation behind this? One aspect is that during met coal market downturns, significant supply tends to exit the industry as higher-cost, unprofitable mines are idled. To illustrate this, I would point you to the met coal price downturn in 2015-2016, which led to the closures of a number of the highest-cost mines globally. As shown in the chart below, coking coal production globally decreased noticeably during 2015-2016 in response to declining coking coal demand. Below are several specific mine shutdown examples:
Back in 2015, AMR idled its Kentucky met coal mine, citing “the decline of both the thermal and metallurgical coal markets as the reason for the idling.”
Western Coal shut down the Wolverine mine in Canada in 2014 (before restarting it in late 2016).
In 2015, Patriot Coal idled its high-vol met coal mine “due to market conditions.”
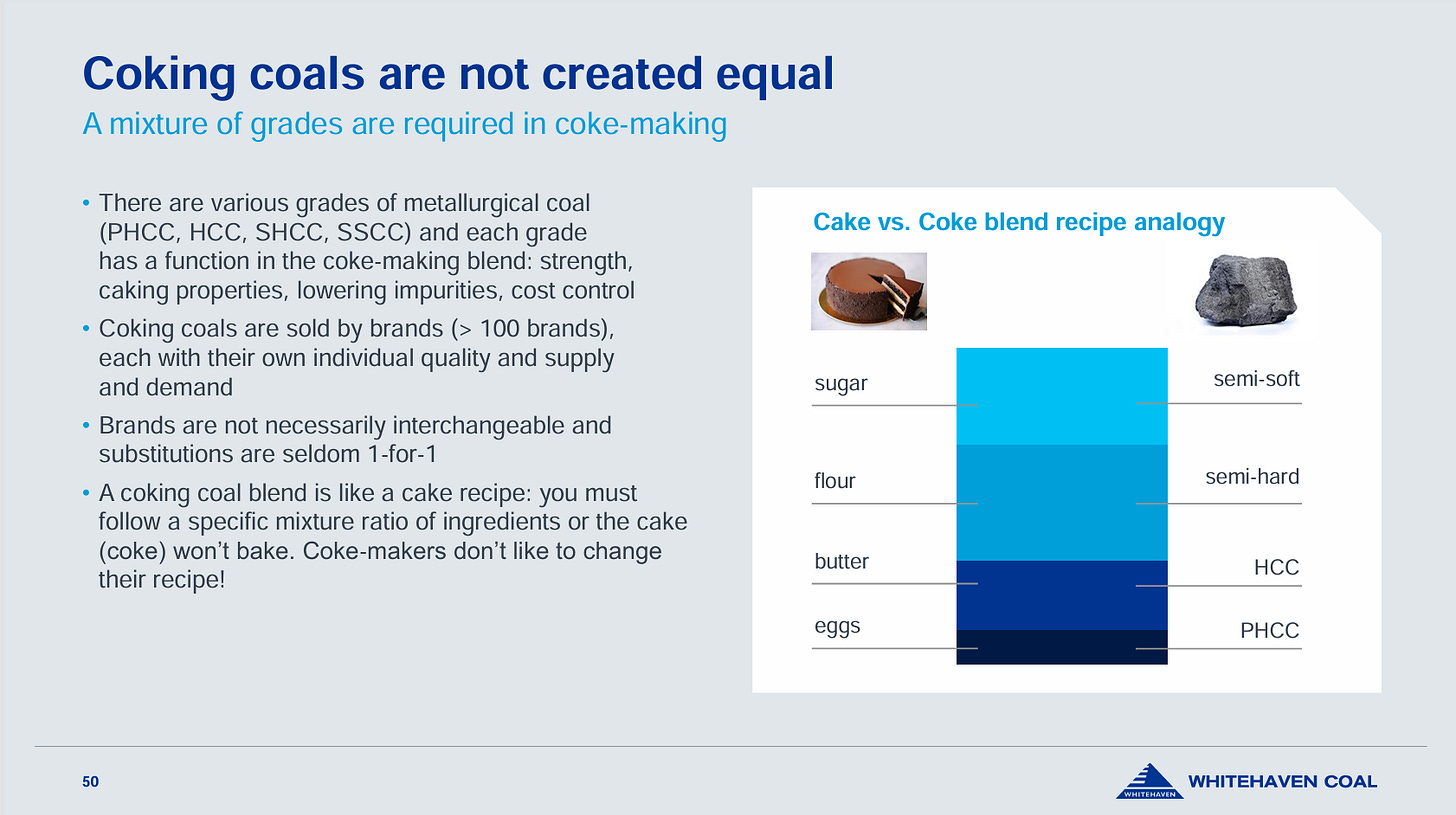
Another explanation is that met coal comes in a variety of qualities and grades. Given the limited number of coal-producing regions globally, this makes met coal geographically scarce for certain quality coal. To illustrate the range of different met coal grades/specifications, I would refer you to this presentation from Whitehaven. As shown in the slide below, coke-making requires a mixture of met coal grades with different properties (over 100 in total). Each coking coal brand is not necessarily interchangeable or substitutable, as every steelmaking plant has its own formula for coal mixtures. While different coal brands generally move directionally in tandem, each has its own individual supply and demand, with demand being less elastic than for a typical commodity. This partially explains why the price for specific met coal brands is unlikely to fall below marginal costs.
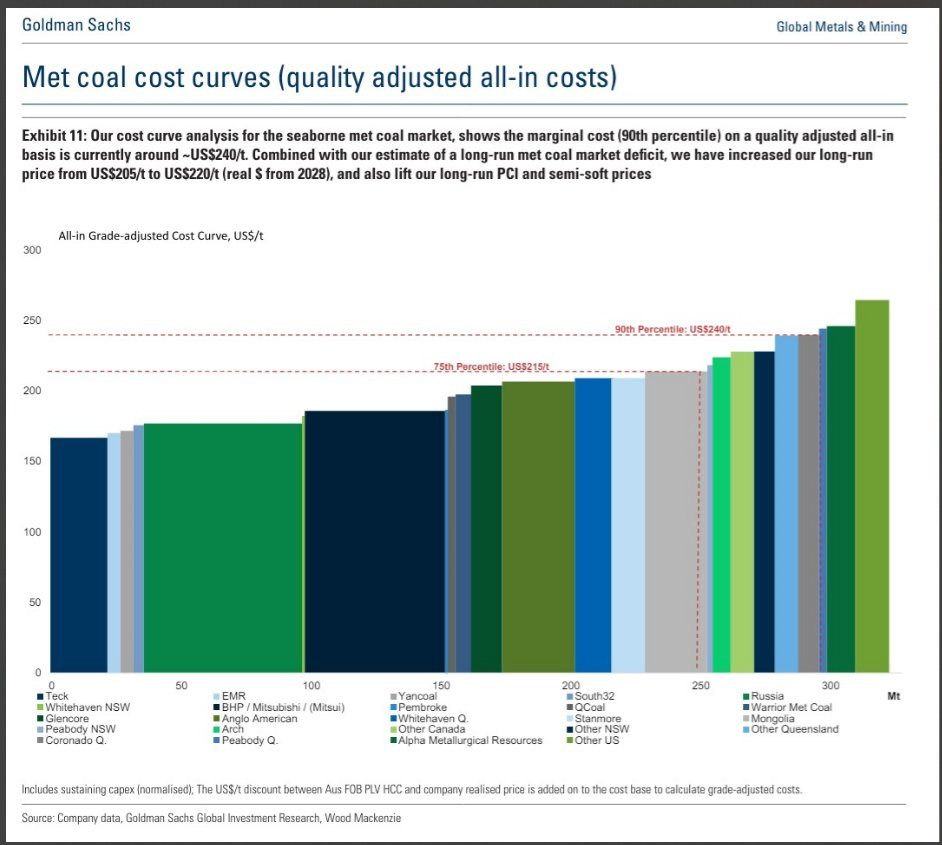
This brings me to the next question: “How does the current met coal production cost curve look, and where are AMR and other US-based producers located on it?” As shown in the chart below, AMR's quality-adjusted all-in PLV HCC production costs currently stand at c. $250 per ton, putting the company just above the 90th percentile producer. As for ARCH, its production costs currently stand nearby, at around $230 per ton on a quality-adjusted basis, while the costs of other US-based producers (other than HCC) are sitting at over $250 per ton. I would note here that, in the cost curve, production costs are adjusted for coal quality (i.e. adding the discount between PLV HCC and coal produced and realized by the company) to allow for comparison between different producers. So, the cost curve likely overstates the actual production costs incurred by some of the producers. Nonetheless, the chart illustrates the point that AMR and other US-based met coal producers are among the swing suppliers.
Another way to assess current production costs is by examining a seaborne met coal cost curve for 2022 from this EIA report, which is not adjusted for quality or grade, unlike the curve above. The chart below indicates that the 90th percentile cash costs are c. $200 per ton, which is broadly in line with current PLV HCC prices. As further evidence that marginal costs broadly align with current met coal price levels, I would also refer you to the recent statement from AMR below. So, these data points suggest that we may be approaching the bottom levels for met coal prices.
As far as marginal cost and the cost curves, I know there's been a lot of conversation about that. I do think that the cost curve number, the, call it, [ $200 to $225 ] zip code is probably reasonable for where the all-in cost is sitting globally.
To be clear, I am not suggesting that met coal prices cannot drop lower than the current levels. As indicated by the price troughs seen in 2015-2016 and 2020, met coal prices might drop below the 90th percentile cost levels. During a recent conference call, AMR’s management hinted that the company intends to retain a strong balance sheet in case met coal prices drop lower (see the quote below), indicating that a decline in met coal price is definitely possible. Nonetheless, I would expect any price deterioration to be temporary, given potential supply reductions.
Yes. I think to put a finer point on it, it's really going to be driven by the coal markets because as long as we remain in this band that we're bouncing around because if you -- I mean, right now, at a roughly [ 215 ] PLV, we're at the lowest point we've been in 2 years. And if you exclude, by my math, about an 11-day period in 2022, it's -- this is the lowest price in 3 years. And so, we're back into some territory we've not had to deal with for quite a while. And that's -- as long as we remain in that band, I think we're going to have to stay focused on keeping the balance sheet strong, giving us plenty of buffer because another turn down, and you could quickly go from producing some cash to producing no cash or consuming cash. And that's going to be the real indicator of when it's time for us to start jumping back into the capital returns.
To illustrate the extent of potential supply reductions and their impact on met coal price, I would again refer you to the second met coal cost curve above. The chart indicates that at a hypothetical bear case of $170/ton PLV HCC price, only about 125m tons of production (versus c. 250m tons total seaborne production) would remain profitable or break even. While such massive production capacity closures are highly unlikely, given the significant mismatch between coal import demand (around 350m tons as of 2023) and supply, I would expect any potential meaningful supply reductions to drive met coal prices materially higher.
So, hopefully, I’ve established by now that we might be close to the downturn levels in the met coal market. Given the historical tendency of met coal prices to bottom at marginal production cost levels, a significant deterioration in met coal prices does not seem likely. Even if the price experiences a significant decline, I’d expect a rather rapid recovery driven by potential supply reductions.
Let’s now discuss what the normalized mid-cycle met coal prices could be. Making such forecasts is inherently difficult, given the number of factors at play. Having said that, Bernstein data suggests that met coal has, on average, historically traded 38% above marginal cost levels. With the current PLV HCC 90th percentile costs of c. $200/ton (as per the IEA cost curve and the quote from AMR above), this would imply a price of c. $280/ton for PLV HCC. I would note that the historical premium estimated by Bernstein is admittedly a bit dated (published in 2015). Moreover, the normalized met coal price estimate might be overly optimistic, given that the long-term met coal price from 2007 to 2024 has stood at $199/ton (see the chart from CRN-AX below). On the other hand, one must take into account the inflation during the period (approximately 150% in the US from 2007 to 2024), which has made met coal mining more expensive. Just since 2020, average production cash costs for seaborne met coal exports have jumped by over 25%. So, the $199/ton price should clearly be adjusted upwards. Here, I would also point out that the historical average price may not fully indicate forward normalized price levels, given the decrease in supply over the last decade driven by steadily declining capital expenditures toward supply (see here, p. 50).
With these points in mind, I think it is reasonable to assume a $260/ton normalized PLV HCC price, i.e., 30% above the long-term average price level. While this is clearly not a precise forecast, I think this estimate is likely a directionally correct estimate of long-term met coal pricing.
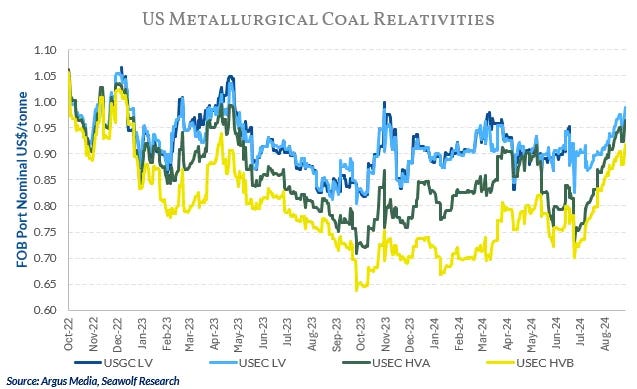
With this met coal price estimate, it is not hard to see the value in met coal producers. Returning to the example of AMR, the company currently trades at c. 12x forward FCF. It is admittedly difficult to specify the price at which AMR could realize its met coal at higher PLV HCC prices. Nonetheless, for simplicity, let’s assume that AMR’s realized price discount to PLV HCC would stand at 25%. I’d note that this might be conservative, as the discount of the LV, HVA and HVB coal (produced by AMR) to PLV HCC has ranged from 35% to negative 5% in recent years (see the chart below). With this assumption and estimated 80% FCF conversion, a $260/ton PLV HCC price would imply $260m in incremental free cash flow for AMR in 2024 compared to the estimated $221m forward FCF. This would significantly reduce the P/FCF multiple to c. 6x.
Aside from low valuations at normalized met coal price levels, what makes met coal producers interesting is that they present the optionality of met coal prices going up substantially due to any potential supply or production disruptions. I would again refer you to 2022 when the war in Ukraine, coupled with the reopening of economies post-lockdowns, led to a massive met coal price jump. The chances of such an event reoccurring are admittedly low. Nonetheless, supply shocks are definitely possible. Here, I would highlight several recent production outages:
In June, Anglo American halted production at its Grosvenor mine in Queensland, Australia, after an underground coal gas fire. The mine was expected to produce c. 2.3m tons of coking coal in H1’24.
In July, Allegheny Met Coal’s Long View mine in West Virginia was closed “due to an underground fire.” The mine has boasted a production capacity of c. 3.1m short tons of met coal annually.
As detailed in this article, there were 87 coal mine accidents in China’s Shanxi province in 2023, putting the operations of the involved mines on hold.
It would not be unreasonable to expect occasional similar mine outages to continue disrupting the met coal supply. Again, there is no certainty that any significant supply disruptions will take place in the foreseeable future. However, the point I am trying to make here is that in the near to medium term, only negative supply surprises are likely. And, given the already limited met coal supply globally, any significant supply chain disruptions would likely have a material impact on met coal prices.
So, this caps off the second part of the article series on the met coal industry. My key takeaway is that met coal prices might currently be at trough levels, indicating that at the present moment, the met coal industry might be an attractive sector to look for investment opportunities.
I expect to return with the final article of the series, where I will dive deeper into specific met coal producers, in the coming weeks.




Seriously great, I agree with this
Can’t wait for part 3, this write up is amazing